
The short answer
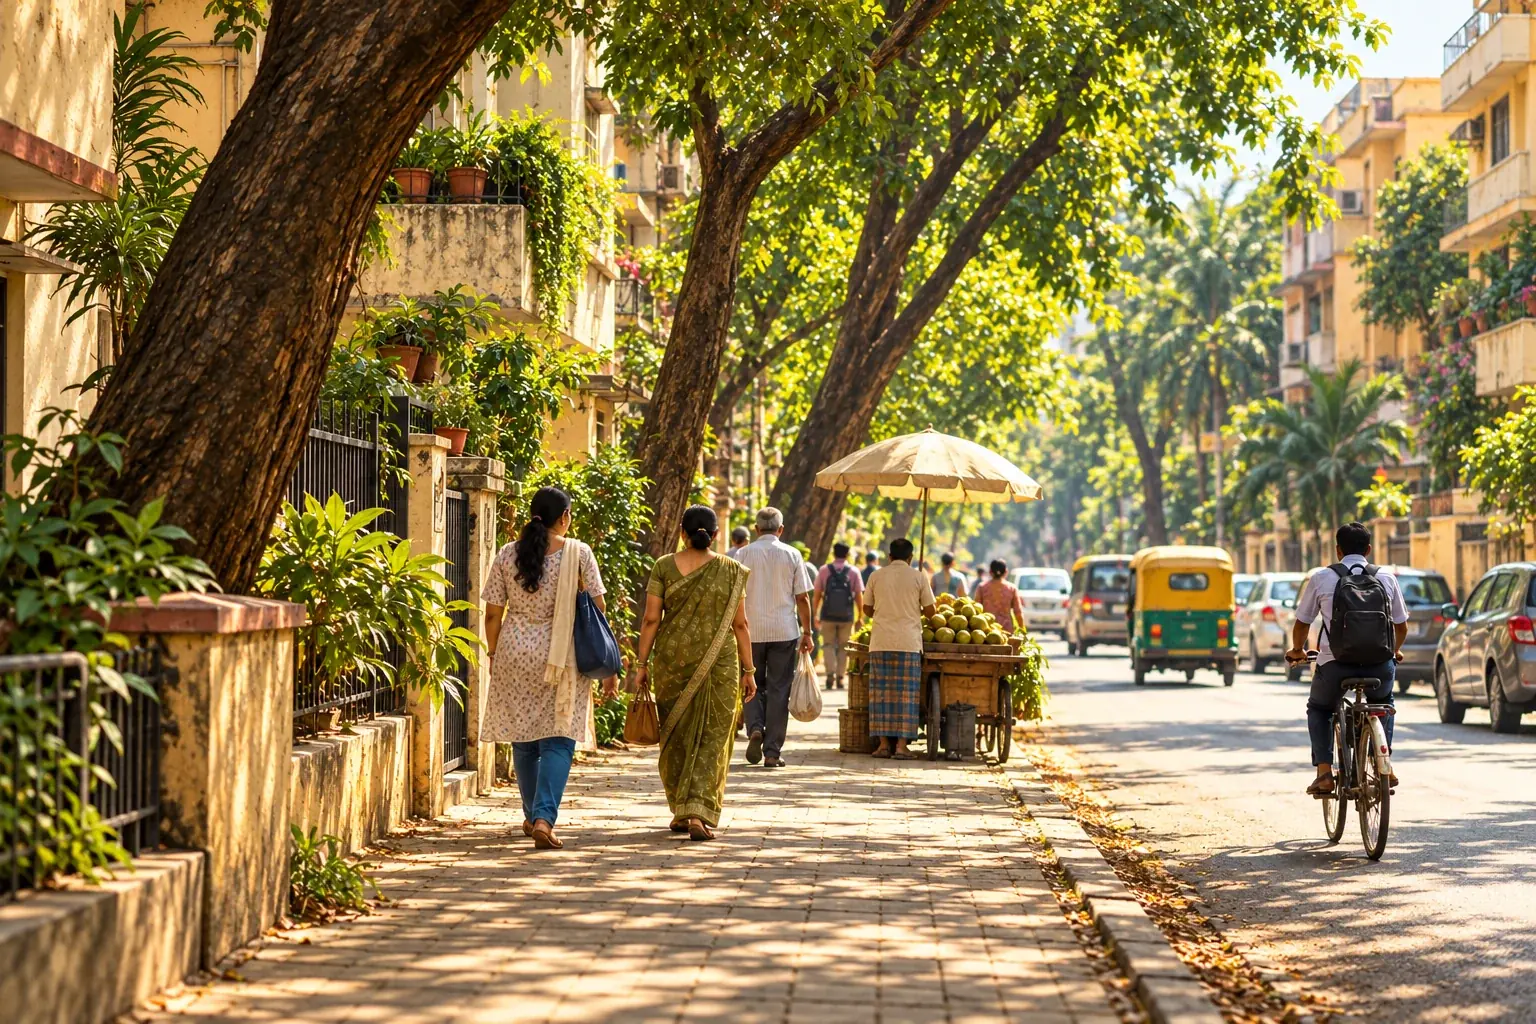
Some streets are hotter because they hold more heat and release less of it. Dark, hard surfaces absorb sunlight, tightly packed buildings trap warm air, and a lack of trees and open ground means there is little shade or cooling from plants. The US Environmental Protection Agency (EPA) reports that daytime air temperatures in urban areas can be about 1 to 7°F higher than in outlying areas (roughly 0.6 to 3.9°C), and nighttime temperatures about 2 to 5°F higher (roughly 1.1 to 2.8°C). Inside one city, the gap between two neighbourhoods can be just as real.
What makes one street hotter than another?
The EPA lists five main causes of what it calls heat islands. Each one can be seen on an ordinary street, which makes this a good checklist for readers.
| Cause (EPA) | What it looks like on a street |
|---|---|
| Fewer natural landscapes | Few trees, little grass or soil, no water. More hard, dry ground. |
| Urban materials | Pavement and roofing reflect less sunlight and absorb and release more heat than natural surfaces. |
| Urban geometry | Closely spaced buildings and narrow streets can trap heat and block cooling winds. |
| Human activity | Vehicles, air conditioners, buildings and industry give off waste heat. |
| Weather and geography | Calm, clear conditions strengthen the effect. Strong wind and cloud cover weaken it. |
The EPA also notes that surface temperatures change more during the day than air temperatures do, while at night the two are generally similar. This matters when you read a heat map: a satellite image of a rooftop or road surface shows how hot the material is, not how hot a person feels walking past.
How much hotter are they?
Two sources give a sense of scale. The EPA figures above come from United States research and describe urban areas against the land around them. For Pakistan, a satellite study of Lahore by M. A. Basheer and M. A. Waseem compared land surface temperature across three years, using Landsat imagery from 1998, 2010 and 2021.
| Lahore land surface temperature (study figures) | 1998 | 2010 | 2021 |
|---|---|---|---|
| Built-up areas | 27.57°C | 34.20°C | 38.23°C |
| Vegetation | 26.00°C | 31.82°C | 35.99°C |
| Water | not reported here | 29.99°C | 30.48°C |
Three findings stand out. Built-up land was the warmest category in every year. In 2021 it averaged 2.24°C warmer than vegetation (38.23 minus 35.99) and 7.75°C warmer than water (38.23 minus 30.48). And built-up area grew from about 10% of the study region in 1998 to 39% in 2021, while vegetation and water bodies shrank. The study also reports that average land surface temperature across the region rose from 26.52°C to 37.40°C over those years, about 0.47°C per year (a rise of 10.88°C over 23 years).
Who is exposed, and why shade matters
A hotter street matters most for people who cannot avoid it. The EPA names older adults, young children, low-income populations, outdoor workers, and people with chronic conditions, disabilities, limited mobility or certain medications as most at risk. WHO makes a similar point and adds that the urban and rural poor are often disproportionately exposed to overheating because of low-quality housing and no access to cooling.
The scale is large. A WHO fact sheet reports that studies estimate about 489,000 heat-related deaths each year between 2000 and 2019, with 45% of them in Asia. WHO also states that cities are not being designed to minimise the build-up of urban heat, and that shade can reduce how hot you feel by more than 10°C. That last figure is about perceived heat, not the temperature of the air.
The EPA adds a cost beyond health. Heat islands raise air-conditioning demand, and the page states that demand rises 1 to 9% for each 2°F increase in temperature. Where power comes from fossil fuels, that raises air pollution and greenhouse gas emissions too.
Three worked examples
These are examples, not measurements from any real street. They show how to apply the figures above.
- Reading a satellite gap. Suppose a map shows a dense market district at 38.23°C and a nearby park at 35.99°C, matching the Lahore averages. The gap is 38.23 minus 35.99, so 2.24°C. That is a difference in surface temperature, so it tells you where heat builds up, not what a shopper feels at noon.
- Estimating energy demand. If one neighbourhood is 4°F hotter than another, that is two steps of 2°F. Using the EPA range of 1 to 9% per step, air-conditioning demand could be roughly 2% to 18% higher. This is a rough planning range, not a bill forecast, because buildings and tariffs differ.
- Converting a temperature gap. A 5°F nighttime gap is a difference, so convert it by multiplying by 5/9: 5 x 5/9 = about 2.8°C. Do not subtract 32 when converting a gap, only when converting an actual temperature reading.
How to check your own street
You do not need equipment to start. A careful observation is a good first step, and it is clearer when you separate what you saw from what you assume.
- Pick one route you really walk, such as home to a bus stop or market. Note the date, time and weather.
- Count the places on the route where a person can stand in shade, and the longest stretch with none.
- Note what the ground and walls are made of, and whether the street is narrow with tall buildings or open.
- Note who is outside at that time: workers, vendors, children, older people waiting.
- If you have a thermometer, record the reading in shade and in sun at the same minute. Write down where you held it.
- Repeat on another route or at another hour, so you are comparing like with like.
If you want to ask the local authority a question, you can adapt this message:
Dear [office name],
I walk along [street or area] every day. On [date] at [time], I counted [number] shaded places along [distance or description], and the longest stretch without shade was about [distance]. Many people waiting there were [for example: vendors, school children, workers].
Could you tell me whether there are plans for shade, trees or covered waiting areas on this route, and who is responsible for them? I would be glad to share my notes.
Thank you,
[Your name]
If you would like to share what you notice with us, see how to get involved. We agree publication and credit with you before anything is shared. For a related field guide, read A cooler city starts with a safer street, or see the work of One Tree.
What these numbers cannot tell you
The EPA figures describe US urban areas and are used here to show the idea, not to predict the temperature on a particular street in Pakistan. The Lahore study measures land surface temperature from satellites, which is different from air temperature, and it covers one city across three snapshot years. We have not found, and do not claim, a published street-by-street measurement for your area. The WHO shade figure is about how hot a person feels. Measured local data from a city weather service or a university would be the next step.
Key takeaways and quick answers
- Heat builds up where surfaces are hard and dark, buildings are packed together, wind is limited and shade is scarce.
- In Lahore, built-up land averaged 2.24°C warmer than vegetation and 7.75°C warmer than water in 2021, according to one satellite study.
- Older adults, young children, outdoor workers, people with health conditions and low-income groups are most exposed.
- A simple route count of shade, with date and time, is a useful first record.
Is a hot street the same as a hot city?
No. Heat can differ a lot inside one city. The EPA describes urban areas as warmer than outlying areas, and the Lahore study found built-up land was warmer than vegetated land and water within the same city.
Does planting trees cool a street?
Trees add shade and plants release moisture, and WHO says shade can reduce how hot you feel by more than 10 °C. The size of the effect depends on where and how many trees are planted and who looks after them.
Who is most at risk on very hot streets?
The EPA and WHO both name older adults, young children, outdoor workers, people with existing health conditions and low-income groups as most exposed.