
The short answer
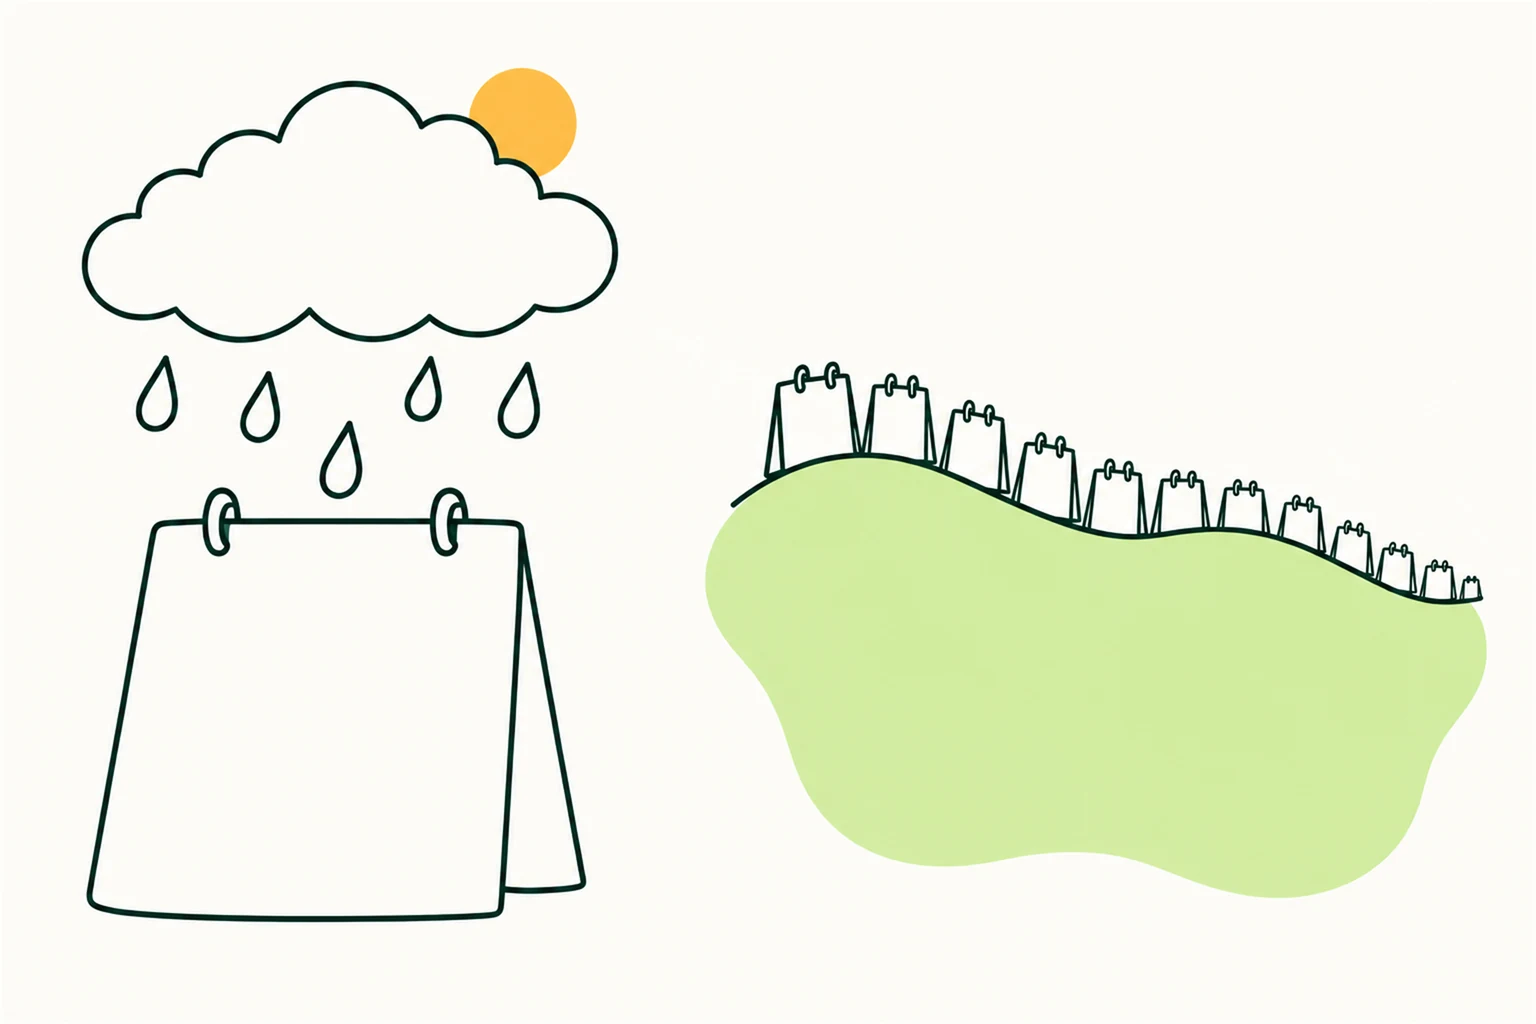
Weather is what the atmosphere is doing now or over the next few days. Climate is the typical pattern of weather in a place over a long period. NOAA puts it in one line: "Climate is what you expect, weather is what you get." Knowing the difference helps you judge claims, because a single hot, cold or wet day can never prove or disprove a long-term trend.
The definitions, side by side
| Weather | Climate | |
|---|---|---|
| What it is | Short-term conditions of the atmosphere (NOAA) | The average daily weather for an extended period of time at a certain location (NOAA) |
| Time scale | Hours, days, a week | Standardised by WMO as a 30-year period |
| Example from NOAA | It may be 75°F and sunny, or 20°F with heavy snow | You can expect snow in the Northeast in January or hot, humid weather in the Southeast in July |
| What you ask | Do I need an umbrella today? | When is the rainy season, and is it changing? |
NOAA's page does not give a number of years for "an extended period". The standard figure comes from the World Meteorological Organization (WMO), as described next.
Why climate is measured over 30 years
NOAA's National Centers for Environmental Information describes WMO's Global Normals as calculated for a uniform 30-year period. In 2015, WMO changed the definition of a Climatological Standard Normal to the most recent 30-year period finishing in a year ending with 0. The current set covers 1991 to 2020. Counting inclusively, 2020 minus 1991 plus 1 gives exactly 30 years.
The reason for a long window is simple. A single year can be unusually wet or dry. Averaging over three decades smooths those swings so that the underlying pattern, and any change in it, becomes visible.
What the long record shows
When scientists look at long records, the picture is clear. The Intergovernmental Panel on Climate Change (IPCC) states in its Sixth Assessment Report synthesis that "human activities, principally through emissions of greenhouse gases, have unequivocally caused global warming". It reports that global surface temperature was 1.09°C higher in 2011 to 2020 than in 1850 to 1900, with a range of 0.95 to 1.20°C. That range is 0.25°C wide, and it shows how uncertainty is stated openly. The report also states, with high confidence, that atmospheric CO2 concentrations in 2019 (410 parts per million) were higher than at any time in at least 2 million years.
Notice what kind of statement this is. It is a global average over a decade, compared with another multi-decade period. It is not a prediction about next Tuesday in any city.
Why the difference matters
Confusing weather and climate leads to two opposite mistakes. One is to dismiss climate change after a cold week. The other is to blame every storm or heatwave on climate change without evidence. The World Health Organization (WHO) describes both layers. It says climate change is making extreme weather events such as heatwaves, storms, floods and droughts more frequent and intense, and that gradual shifts in temperature, rainfall and sea level act as growing stresses on health. It also notes that estimating the scale of many climate-sensitive health risks remains challenging, especially for drought and migration pressure.
WHO projects approximately 250,000 additional deaths per year from 2030 to 2050 from undernutrition, malaria, diarrhoea and heat stress alone. It adds that, in the short to medium term, health impacts depend mainly on how vulnerable people are and how well they can adapt, and in the longer term on how much emissions are reduced now.
Three worked examples
These are illustrations of the method, not records of any real place.
- The cold morning. A viral post says, "It was 4°C this morning, so global warming is a lie." That is one measurement of weather. To test it against climate you would need the average for that location over a 30-year window, and a trend, not a single reading.
- The next normals. By WMO's rule, the standard normal is the latest 30-year period ending in a year with a 0. After 1991 to 2020, the next period ending in a 0 year is 2030, so it would cover 2001 to 2030 (2030 minus 30 plus 1 equals 2001).
- A heatwave in your city. A heatwave is weather. Whether heatwaves are becoming more frequent or intense in your region is a climate question. It needs a long record, such as decades of daily maximum temperatures, and careful analysis to answer. A local weather service or university is the right source.
A simple habit for reading claims
When you see a temperature or rainfall claim, ask these four questions:
- How long a period does it describe: a day, a season, or decades?
- Where does it apply: one city, a country, or the whole world?
- Who measured it, and can I open the source?
- Is it comparing like with like, such as the same months or the same 30-year window?
Our guide on how to tell good climate information from bad goes further with a six-question check.
What this article cannot tell you
NOAA's definitions are written from a United States perspective, and the examples use US places. The IPCC figures are global averages, so they do not describe temperature in Pakistan, Kenya or any other single place. The WHO projection covers a selected set of health causes, not all effects of climate change. For national or local climate records, look to your national meteorological service.
Key takeaways and quick answers
- Weather is short-term. Climate is the long-term pattern, standardised by WMO over 30 years.
- The current standard normal period is 1991 to 2020.
- Global surface temperature was 1.09°C higher in 2011 to 2020 than in 1850 to 1900, according to the IPCC.
- One day, however hot or cold, cannot confirm or disprove a climate trend.
Does one cold day disprove climate change?
No. A cold day is weather. Climate is the pattern over an extended period, which the World Meteorological Organization standardises as 30 years, so one day cannot confirm or disprove a long-term trend.
Why does climate use a 30-year average?
A long window smooths out year-to-year swings so the underlying pattern is visible. WMO's Climatological Standard Normal is the most recent 30-year period finishing in a year ending with 0, which is 1991 to 2020 at present.
Is weather forecasting the same as climate science?
No. Forecasts describe conditions in the coming hours and days. Climate science looks at long-term averages and trends, such as the IPCC finding that global surface temperature was 1.09°C higher in 2011 to 2020 than in 1850 to 1900.